In this blog, we discuss all the capabilities and benefits Microsoft provides to monitor Microsoft Fabric.
With the debut of Microsoft Fabric, data analysts now have an all-in-one technology solution that offers a collection of services including data lakes, engineering, and integration. With the availability of so many rich and diverse technologies — which need to periodically collect, analyze, and use information to actively manage performance, maximize positive impacts, and minimize the risk of adverse impacts — monitoring becomes an essential part of it.
Monitoring is a crucial part of modern analytics platforms for maintaining quality of service and gaining insight into system functionalities. Monitoring and managing your analytics platform ensures it continues to meet your organization’s evolving data and analytical needs effectively and efficiently by:
- Enabling real-time performance optimization, fault detection, and prevention.
- Ensuring scalability.
- Enhancing security.
- Aiding in cost management.
- Improving the user experience.
Additionally, monitoring supports compliance, predictive maintenance, and continuous improvement, making it an essential practice for maintaining a robust and efficient analytics ecosystem.
By integrating technologies like Data Factory, Synapse Data Engineering, Synapse Data Science, Synapse Data Warehousing, Synapse Real-Time Analytics, Power BI, and Data Activator into Microsoft Fabric, it now facilitates the end-to-end analytical solution. With more power and features it becomes a challenge for administrators to manage these resources under Fabric. However, Fabric provides tools to tackle these challenges.
Monitoring In Microsoft Fabric
Undoubtedly, Microsoft understands the critical need for monitoring resources, so Fabric provides a full set of features to monitor and track the use of resources and activities.
Monitoring Hub
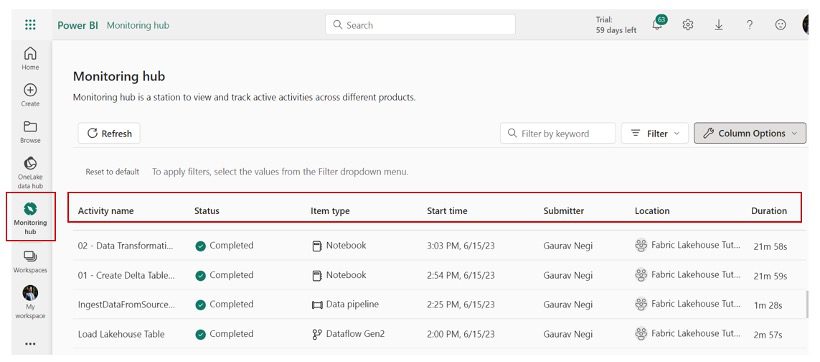
As the name indicates, Monitoring Hub helps users monitor activities within Microsoft Fabric. It is a station to view and track active activities across Microsoft Fabric, such as dataset refreshes, Spark Job runs, and many others, from a central location.
A user with read permissions on datasets of any of these items could see them in their Monitoring Hub.
Monitoring Hub displays activities based on which service is being used when Monitoring Hub is selected. During the Microsoft Fabric public preview, Monitoring Hub was available for Power BI, Data Factory, Data Engineering, and Data Science workloads only. Now that Fabric is generally available (GA), watch this space as the monitored offerings are likely to expand.
Monitoring Hub displays the standard information below within columns across all workloads:
- Activity name: Name of the artifact.
- Status: Cancelled, Completed, Failed, In Progress, Not Started and Unknown.
- Item type: To which type it belongs like Dataset, Datamart, Lakehouse, Data pipeline, Spark Job Definition, and more.
- Start time: At what time its execution starts.
- Submitter: Who initiates the activity?
- Location: To which workspace it belongs.
- Duration: How much it took to process.
Apart from these, it provides additional column options specific to the viewing context, such as Power BI or other workloads.
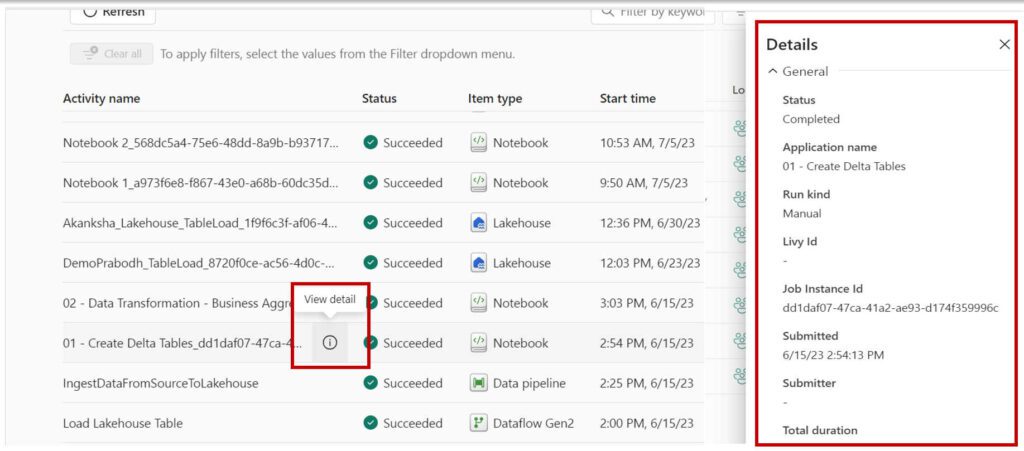
Not only that, but the user could also further open a detail pane for the item itself when you hover over the item.
Track User Activities in Microsoft Fabric
Monitoring activities is one part of what an administrator needs to do, but to monitor who is taking what action on which item of Fabric is a crucial piece of information that helps an organization regulate compliance and record management.
Microsoft Fabric logs activities in the Power BI activity log and in the unified audit log. These log features were there before Fabric’s debut and existed only for Power BI. In light of that, for Power BI there are a lot of operations that have been tracked. But for other Fabric workloads, currently only create, read, update, and delete operations can be tracked.
Microsoft recommends using the Power BI activity log as it contains information related to Fabric auditing events only. Also, Power Platform administrators and Power BI administrators can access these, so global administrator roles aren’t required to access them.
Within the Power BI activity log, the complexity comes in retrieving the logs. Administrative users need to be familiar with the Power BI Admin API and Power BI PowerShell modules as well as understand there can be a lag of 30 to 60 minutes to retrieve event information.
On the other hand, if one opts for the Audit Log, you will need to be a global admin, a role that most organizations are not comfortable granting to very many people. If one has audit access only then they can access logs using Microsoft Purview.
With Fabric, one of the essential governing tools is Microsoft Purview. This tool is likely to be further integrated in the future, and once it is live, most organizations are likely to go with Audit Logs. With that choice, the user will not only use PowerShell to access the information from logs, but they will also have the option to use the GUI to search, filter and retrieve information in CSV format.
Feature Usage and Adoption Report
As Microsoft rolled out Fabric, it introduced a new Fabric admin role. This role is responsible for the management of the organization-wide settings that control how Microsoft Fabric works. Users assigned to admin roles configure, monitor, and provision organizational resources.
Below is a snapshot of the admin roles and their duties.
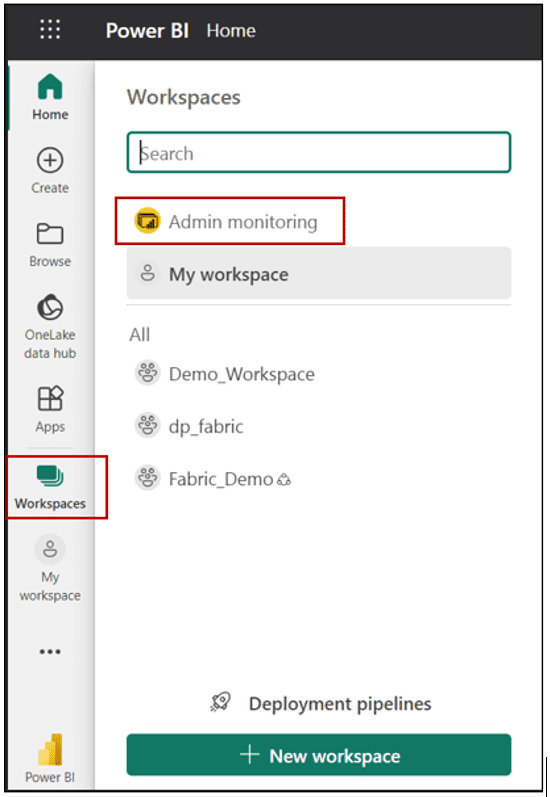
With a minimum role of Fabric admin, the Admin Monitoring workspace is enabled for the user, as shown in the below snapshot:
It is automatically installed during the first time any Microsoft Fabric admin accesses it.
In this workspace, a report called “Feature Usage and Adoption report” is available, which provides a comprehensive analysis of the use and adoption of different features in your Microsoft Fabric tenant.
This report consists of three report pages:
- Activity Overview: Provides a summarized view of activities and usage across the entire organization. Examples include daily activities, user trends, most active capacities, and workspaces. One can also view the activities of the entire organization (by user level as well).
- Analysis: Visualizes data across multiple activity dimensions. It provides a daily count of activities and users by date and a decomposition tree that automatically aggregates data and enables drilling down into dimensions in any order. It helps to understand the activities according to operation and user.
- Activity Details: Displays detailed information on specific or multiple capacity or workspace activities. Detailed information is available via drill through from Activity Overview or Analysis pages.
A Visual Overview of Monitoring in Microsoft Fabric
Below is the bird’s eye information matrix for all three monitoring methods in Fabric.
Conclusion
Monitoring of Microsoft Fabric becomes much easier with all new and diverse activities under Fabric, and Microsoft provides multiple ways to achieve this. These can be very powerful techniques to control and administer all the resources so that you can use resources to their full potential and in a highly optimized manner.


