Hands On with Office 365 Power BI: Part 2
Adding a New Data Source
This is the second post in a three-part series focusing on the fundamentals of Microsoft’s Power BI, a cloud service that allows you to share, collaborate and access Excel reports anywhere on any device.
In this series, you will learn how to add a Power BI License to an Office 365 subscription, add new data sources, and share your report from a SharePoint online document library.
In Part 1, we were able to connect our On-Prem SQL Server to Power BI. In this post, we will now connect our data source (in this case a SQL database) to Power BI so we can run some reports:
Our first step will be to add a new data source from the Power BI admin center. In order to do this, simply click on the “data sources” button on the Power BI Quick Launch, and then click the + sign to add a new data source. For this example, we will click on “SQL Server.” With the latest release of Power BI, we can now also add Oracle databases, SharePoint document libraries, or even custom Power Queries you may have written.
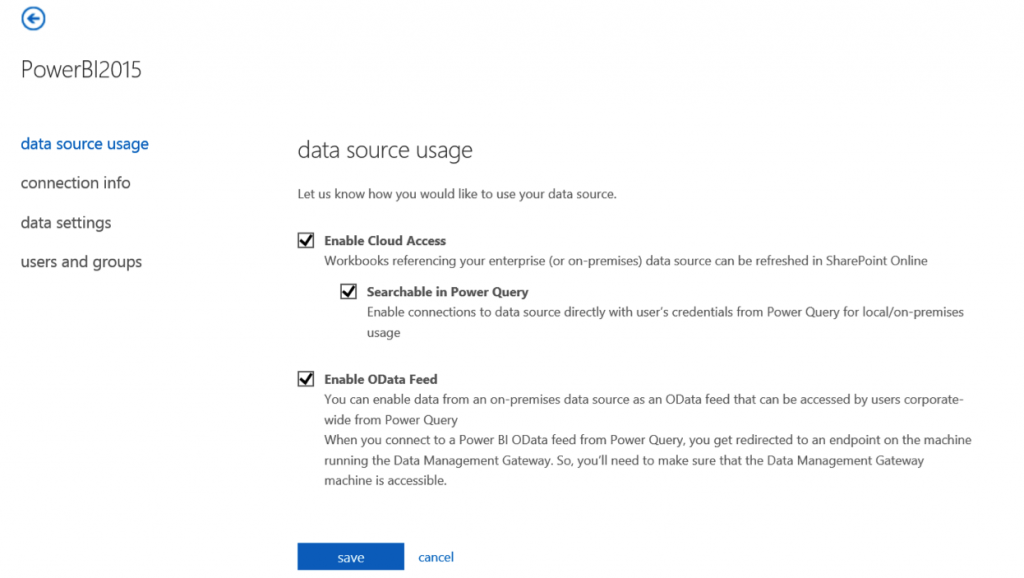
From here, we can now specify the data source connection information. Our first step will be to define how the data source will be utilized. There are three options that can be selected in this part of the wizard:
- Enable Cloud Access – This option is very useful, and will allow you to leverage Power BI to refresh your excel workbooks in SharePoint online. Before Power BI, this was a big limitation in the business intelligence capabilities with using SharePoint Online.
- Searchable in Power Query – This option will allow users who have been granted access to be able to search for these data sources directly from Excel and use Power Query to report on the data they need. (Note: Power Query is an add-on to Excel and can be downloaded here.)
- Enable OData Feed – This will allow your users to be able to use Excel to connect to the data directly as an OData feed. For the purposes of this example, we will use this option in order to quickly and easily connect Excel to our data to create a PowerPivot report.
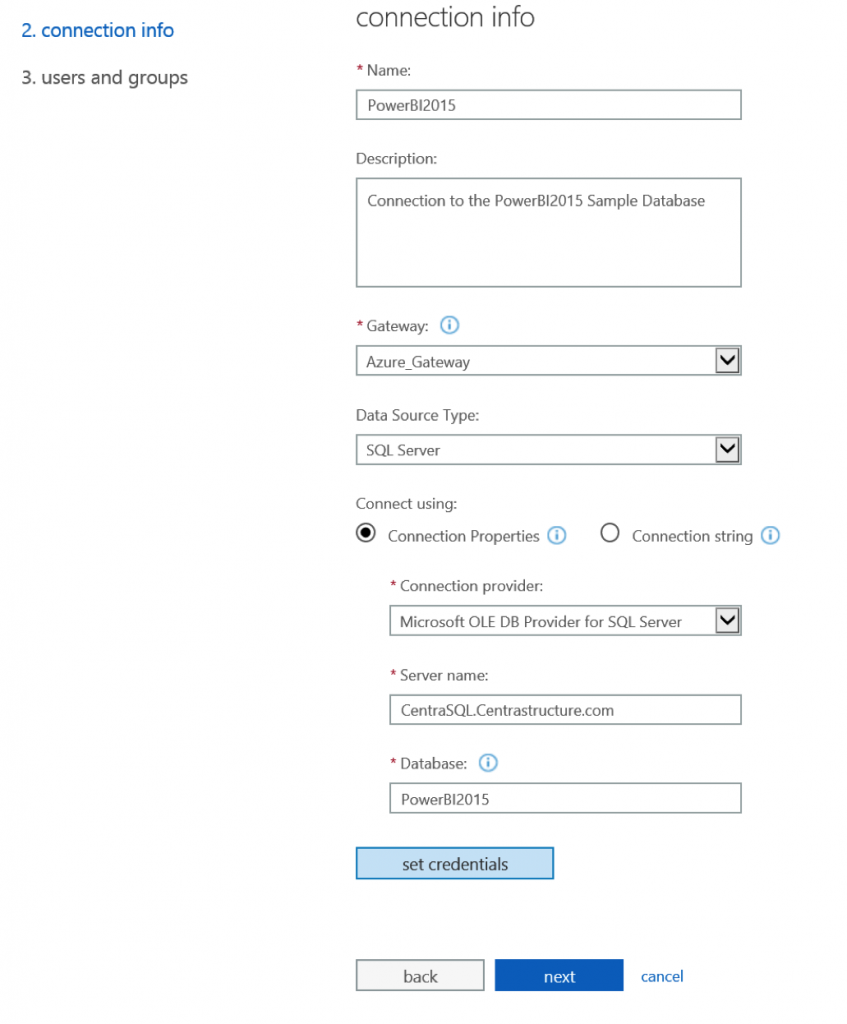
Our next step will be to define the connection information for this data source. We will want to provide a name and description, choose the gateway we created in the first part of this blog post, specify the data source type (in this case, SQL Server), and define our connection properties. You can either use the connection properties dropdown to define the connection, or if you are more advanced, define the entire connection string. For this example we will just use the dropdown to define the connection properties. Before continuing though, we will also want to define the credentials used by this data source to connect to the database.
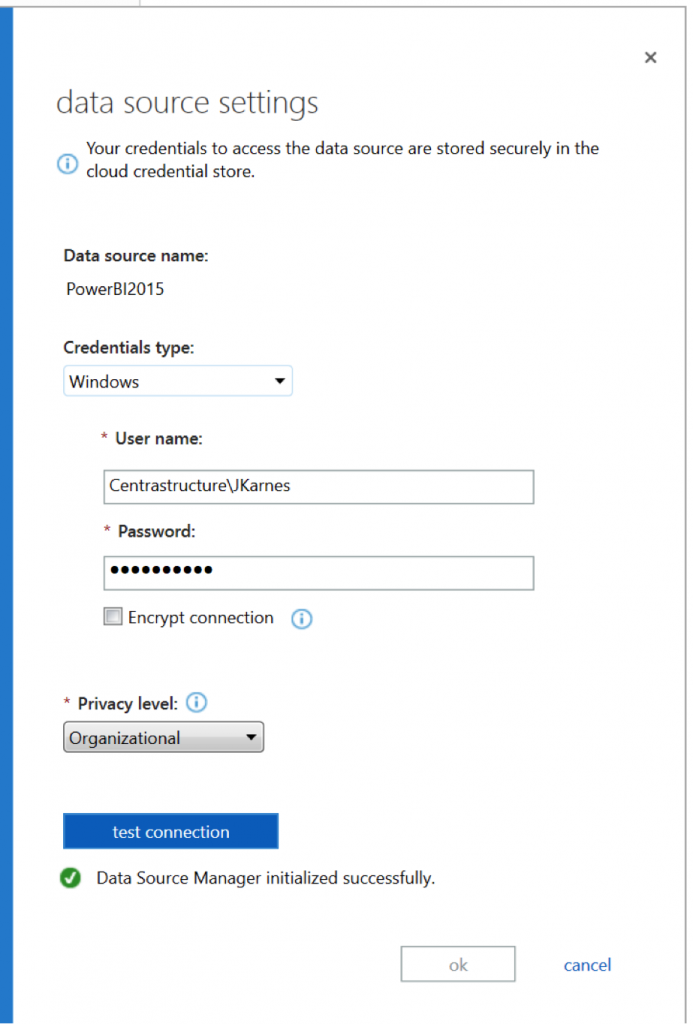
When defining the credentials to use for this data source connection, there are a few things we want to make sure of:
- Use a new service account for these credentials (not a user account). You can define either a database account or a Windows account. A database account is a user who resides only in SQL, while a Windows account would be a user that lives either as a local Windows account, or a domain account.
- If it is a Windows account, make sure they are a part of the “Data Management Gateway Users” local group on your ON-Prem Server.
- Make sure the account has appropriate access to the SQL database. The permission levels may vary on your specific use cases.
Once you have defined the credential settings, click “test connection” to ensure everything is working properly, and click OK to continue the wizard.
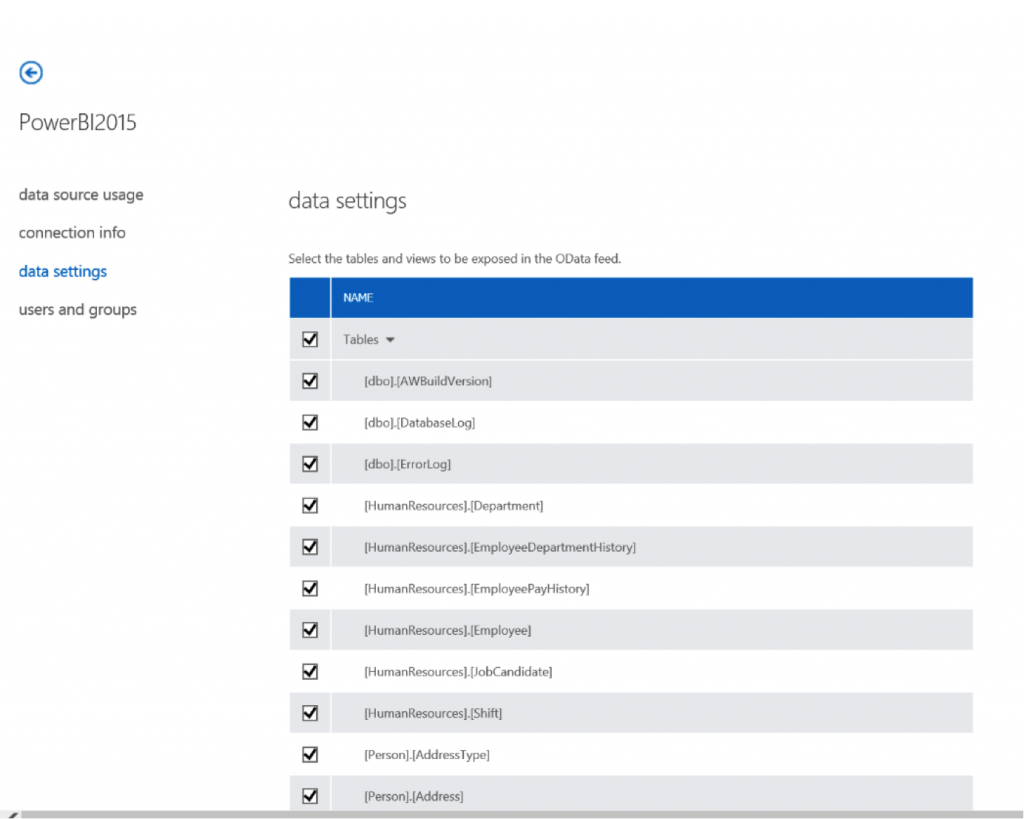
Since for this example we are defining an OData connection, we have the option to only expose specific tables and views as a part of the Odata feed. Choose the tables and views appropriate for your needs to expose, and click “Next.”
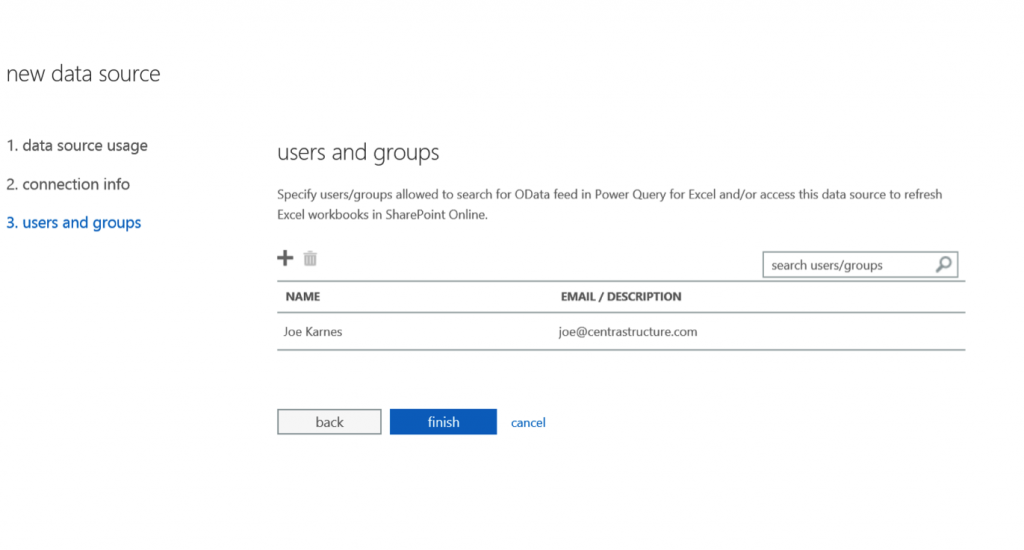
Finally, we need to define the users who will have access to utilize this data source. These users will need to have an Office 365 account on your tenant. I highly recommend defining a group/groups and adding your user permissions that way. It always makes administrative work that much easier in the future. When your users and groups have been defined, click “Finish.”
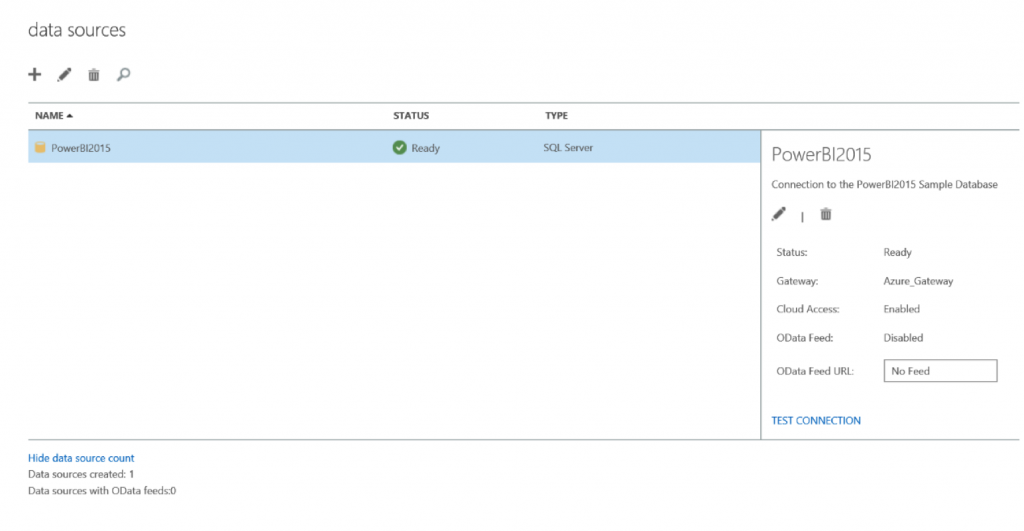
We now have our defined data source ready to be accessed! Now let’s connect and create some reports.
Connecting to the Data Source
Now that the data source is in Power BI, our first step will be to find out the name of our OData EndPoint. To do this, we need to go to the “My Power BI” page, which will provide you with a dashboard of what has been defined for you for Power BI. To access it, you need to click the “Power BI” icon on the top links bar of Office 365:
To get the URL of our endpoint, we just need to click on “Data Sources” on the Quick Launch, click on “Data” on the top link bar, and change our view to “show : all data sources.” We can see the URL in the location column. Let’s copy and paste it so we can quickly add it in when we move to Excel. The easiest way to do this, is to click on the “…”(ellipsis), which will open a box that has our full URL selected.
Connecting Excel to your new OData Feed
Now that we have the OData feed endpoint, let’s connect and create a simple report. Open Microsoft Excel, and click on the “Power Query” tab. In the “Get External Data” area of the ribbon, click “From Other Sources,” and then click “From OData Feed.” This will open a box where you can paste in the URL that we copied earlier. That’s it! You will now be presented with all of the tables from your Odata feed, and you can select each one that you would like to pull information from.
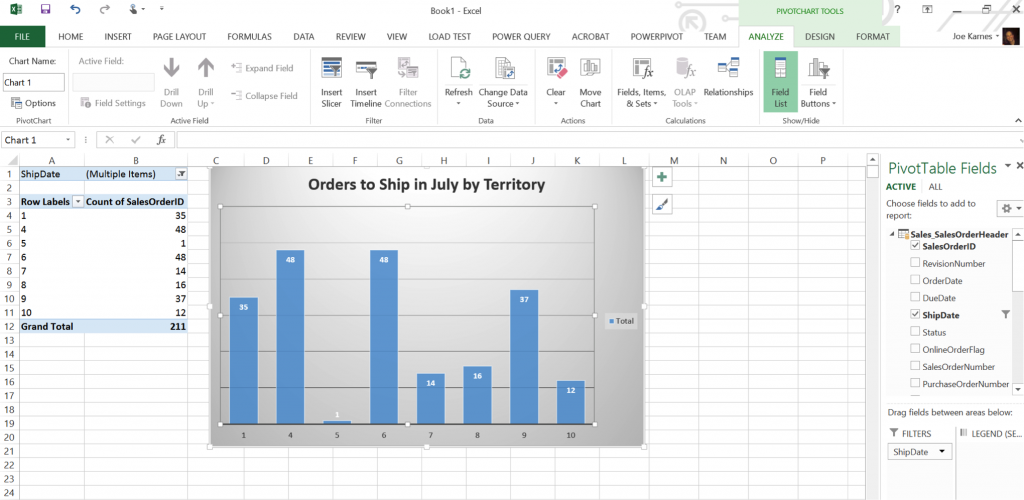
In the picture below I have put together a quick example of a pivot table and pivot chart using data from a table from the database. I can customize and define the report using any of the features in Excel, and now I can also define my refresh settings. This will allow you to refresh the report when it’s opened, or on a timed interval!
So far, this really has been pretty easy to set up. In the next part of this series, I’ll show you different options to publish and share your reports.
Other published posts in this series:

