Useful ideas for maximizing the power of Microsoft Excel for Supply Chain Analysis, Part II
This is the second post in a three-part series that describes how to perform desktop network optimization, job scheduling and vehicle routing with nothing but Microsoft Excel.
Introduction
In the previous post, performing a desktop transportation/ network optimization was discussed. This was an interesting class of problems that produced valuable information and insights regarding the cost and service components of a distribution network. These problems require a good bit of pre-work related to data gathering and analysis, but the worksheet setup is fairly straightforward, perhaps even intuitive. The job scheduling problem requires less pre-work, but the set-up is more complicated and less intuitive. This makes it more difficult to explain…at least in my mind. However, the benefits are much more tangible. If organized properly, the solution methodology can be used several times per day to schedule and re-schedule work. Further, analyzing the results will reveal the location of bottlenecks and opportunities to streamline operations. At the simplest level, the objective of these problems is straightforward: schedule production to get as much work done as possible in the shortest amount of time. However, we will modify the objective slightly to make the problem more realistic. Production orders will be organized such that groups are completed at approximately the same time. Think of this as a way to have specific production orders completed by a certain cut-off time or cut-off date. To solve this problem, leverage the idea that solving an optimization problem consists of two distinct but connected parts: problem set-up and solution search. Like my other post, Microsoft Excel will be the tool for problem set-up and solution search. However, since this class of program does not lend itself to searches based on linear programming techniques, we will once again use the Evolutionary Solver in Excel (released in version 2010) to search for the solution.Characterizing the Problem
In this situation, pretend that you are the manager of a value-added service (VAS) operation. You are responsible for scheduling the jobs through one of eight VAS processing lines. Your lines all have the same capabilities. However, because of differences in equipment, space, experience, and leadership, some of the lines can process work faster than others. You know what these process speeds are and would like to include this information when developing schedules. The company you work for has national contracts and every day you ship completed work all over the United States. Lately, business has been good but this has resulted in a few problems:- A crowding problem where work sits on the floor waiting for a truckload quantity to be assembled so that a truck can be brought in and loaded.
- Carriers complaining that their drivers have to wait too long for a load and are starting to charge penalties for the delay.
- Work stoppages, re-sequencing, and expediting that contribute to inefficiencies.
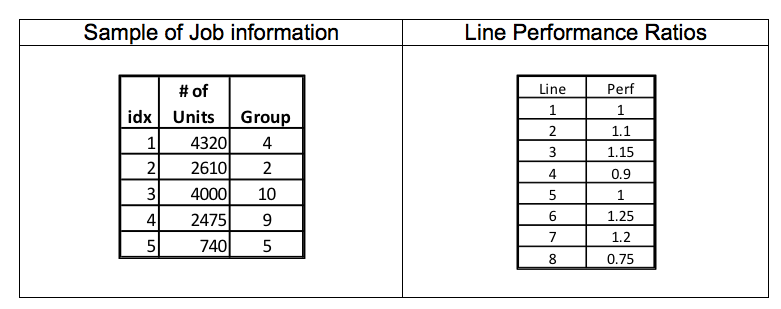 The job information is simple: it consists of the number of units and a group. The job index (idx) is just used to keep track of the job. The line information shows the rate it takes to process one unit in seconds. Thus, line 1 can process 1 unit in 1 second and line 8 can process one unit in .75 seconds.
Setting up the problem for the solution
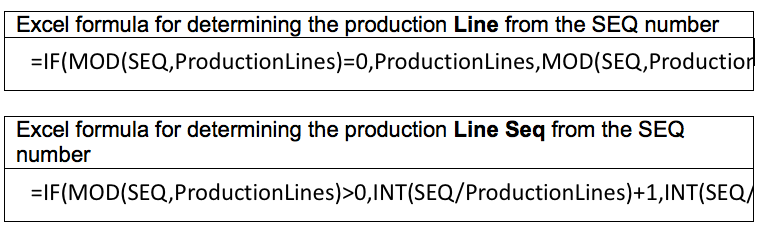
The key to understanding the way this problem is set up is to understand one of the key capabilities of the Evolutionary Solver in Excel. This key capability is the “All Different” constraint. This constraint was designed to order a sequence of numbers to meet specified criteria. Since a scheduling problem is a sequencing problem, this is exactly what we need to do.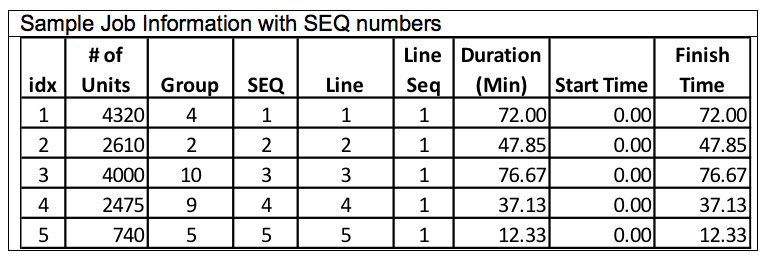 The completed table shows the SEQ number which determines the Line Number and the Line Sequence of the job. The Excel formulae are provided below:
 The Duration, in minutes, determines how long the job will take given its assignment to a particular line. Since different lines have different processing speeds, the duration will vary based on line assignment. Each job starts immediately after the previous job ends. Thus, the Start Time for a particular job on a line is the cumulative time for all the previous jobs on that line. This time is measured in elapsed time from a base of zero. The Finish Time is the sum of the Start Time plus the Duration.
Setting up the Results Viewing Area
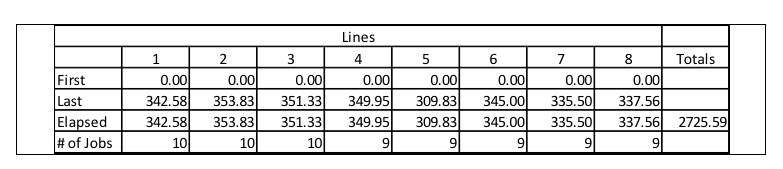
There are two key connected objectives for this problem: 1) Get the work done as quickly as possible while 2) reducing the elapsed time to complete the jobs for each of the groups. The tables that measure these objectives are below.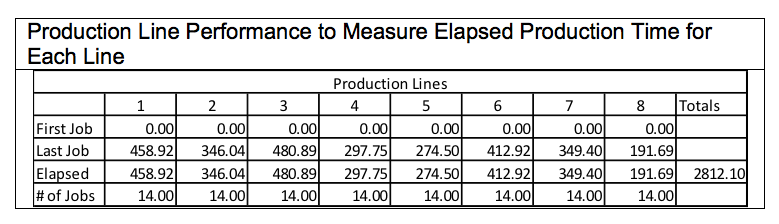
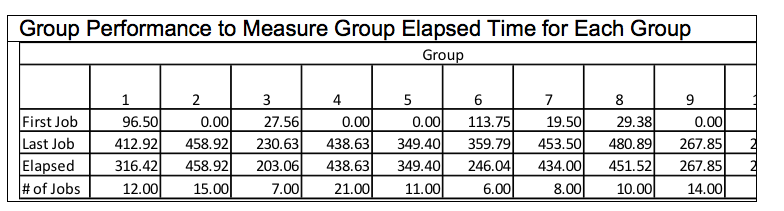 In each case, measurement is the elapsed time between the first job and the last job. The smaller the elapsed time the better.
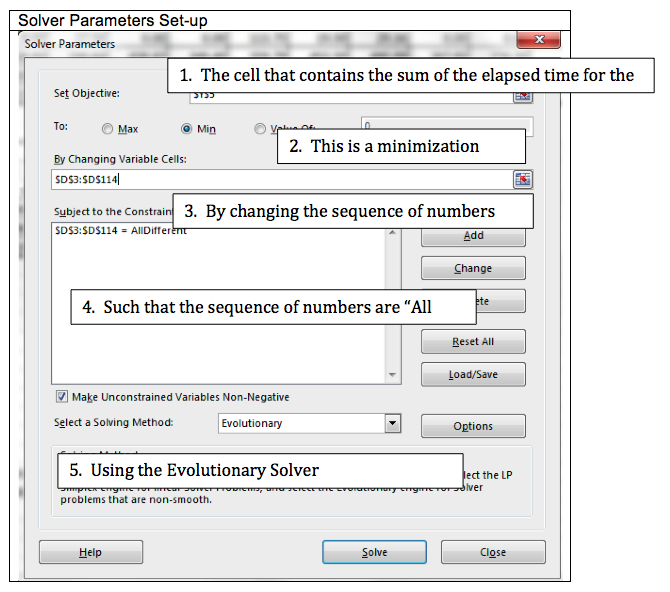
Setting up the Solver
Setting up the solver requires five steps:- Determining the objective cell on the Excel spreadsheet
- Selecting the type of problem
- Detailing the cells that can change to solve the problem
- Defining constraints on the changing cells or other values in the problem
- Selecting the solver to use for the problem
 This gives the following results:
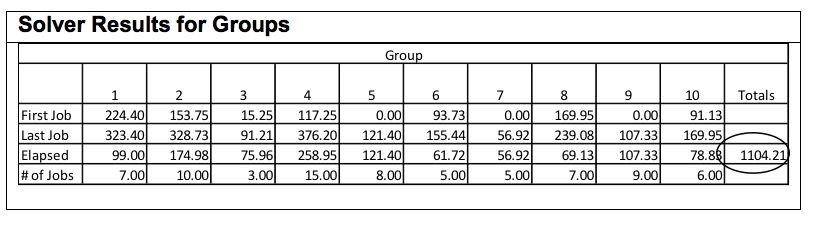 This represents over a 2000 minute improvement in aggregate waiting time and after the initial set up; it took the solver less than three minutes to arrive at this answer.
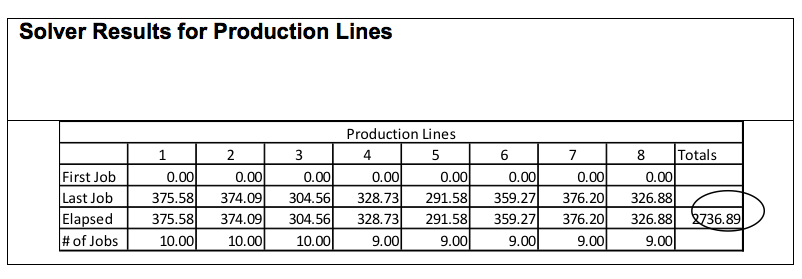 The total time did not improve dramatically. This result is in line with expectations since the “work is the work.” However, the total production time did not increase, meaning that as a solution was generated for one problem, it also improved the other. At this point, it is worth mentioning that using the Evolutionary Solver comes with some drawbacks. Indeed, it is incredibly powerful, but as problem sizes get larger, the Evolutionary Solver has a harder and harder time finding good answers. Also, since the solver is stochastic in nature, the same answer will not be achieved on a subsequent run of the solver. The main reason for this is that the search space for the Evolutionary Solver grows geometrically as jobs are added and the starting location of the search can vary. Five jobs can be ordered 5! or 120 ways. 100 jobs can have 100! or 9.3E157. That’s a lot bigger than Google (1E100). In fact, since there are 2.5E9 seconds in an average lifetime and if we had a computer that could test 1E9 solutions every second, it would still take more than 1E140 lifetimes to test all possible combinations. The galaxy would burn out before that. With a search space that size it is worth wondering if there are better solutions and how the problem can be formulated to reduce the size of the search space.
Improving the Solver Solution
Given that the size of the problem explodes geometrically as the number of jobs increases, it is worth considering how to break up the problem so that it is not so big. One of the ways this can be accomplished is by solving for the most efficient sequencing for each of the ten groups. This would yield the set up below: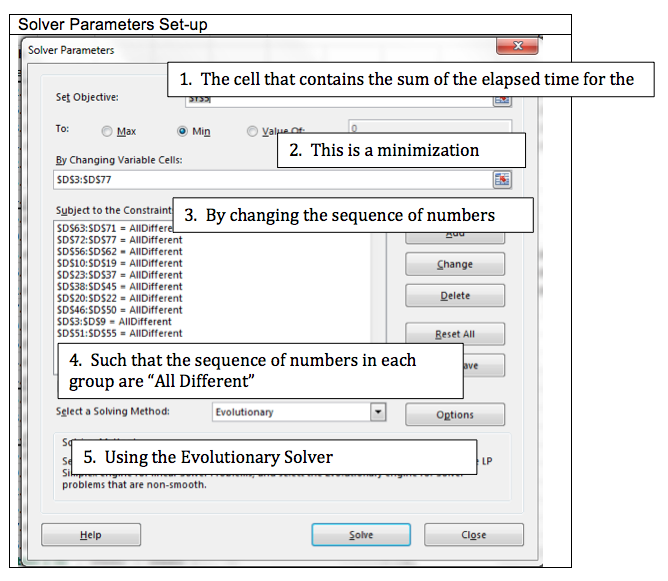 In this setup, the problem has been changed from sequencing a single string of 75 numbers to sequencing 10 strings of varying length. This is dramatically easier for the solver because contained within the formulation is an assumption that Group 1 jobs will be scheduled before Group 2 jobs and so on. This results in a better solution in a faster search time.
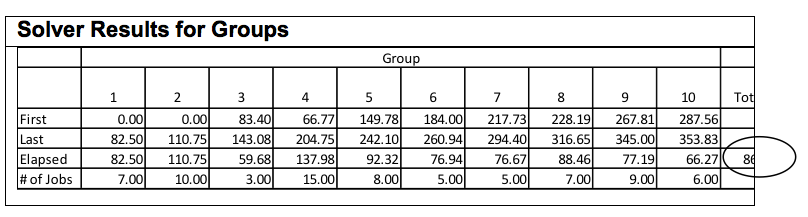 In addition, the overall production time decreased only slightly. Again showing that group elapsed time could be reduced without increasing the total production time.
 In this article, you have learned how to set up a multi-line production sequencing problem in Microsoft Excel and solve it using the Evolutionary Solver. These solutions are not always available with ERP packages and need to be developed outside the system. Understanding how to set up and solve these problems can boost productivity, reduce cost, and increase competitiveness.
Good production scheduling is a foundational requirement for efficient operations and effective asset utilization. Centric would like to help you make the most of your assets by developing new approaches to solve these types of problems. For a discussion or consultation, please contact us.
In the next article, we'll show you how to conduct DIY vehicle routing to minimize distance and transportation expense.
Other published posts in this series:
In this article, you have learned how to set up a multi-line production sequencing problem in Microsoft Excel and solve it using the Evolutionary Solver. These solutions are not always available with ERP packages and need to be developed outside the system. Understanding how to set up and solve these problems can boost productivity, reduce cost, and increase competitiveness.
Good production scheduling is a foundational requirement for efficient operations and effective asset utilization. Centric would like to help you make the most of your assets by developing new approaches to solve these types of problems. For a discussion or consultation, please contact us.
In the next article, we'll show you how to conduct DIY vehicle routing to minimize distance and transportation expense.
Other published posts in this series:
- How to Conduct a DIY Network Analysis to Understand How Location Impacts Service and Transportation Expense (Part I)
- How to Conduct DIY Vehicle Routing to Minimize Distance and Transportation Expense (Part III)

